


- States with the most, least for-profit hospitals

- 8 recent hospital, health system CEO moves
- Why can’t this surgical risk calculator integrate with Epic?
- CVS Caremark, FTC settle insulin pricing case for $13B
- When every answer sounds right: Why clinical intelligence needs a validation layer
- White House launches AI clearinghouse to speed hospital cyber patching
- 8 recent RCM company M&A moves
- Big ideas to fix hospital revenue leakage from 25 leaders
- 19 recent health system CIO moves
- OpenAI, Apple clash over physical AI as healthcare stakes grow
- How better data has built supply chain resilience and 4 more updates
- Smile Doctors secures $125M in capital, closes in on 600 practices
- Tennessee orthopedic practice debuts new campus, future ASC
- OpenAI’s health AI chief: ‘Bet on the models getting better’
- Facing Funding Losses, States Call Out Big Businesses With Employees on Medicaid

- Full-body scan startup Neko Health scores $700M to break into the U.S. market
- Elevance Health's stock slides premarket even as it beats the Street with $1.5B in Q2 profit
- Sanofi teams up with Special Olympics Unified Football World, raises respiratory health awareness
- Insilico signs on with CDMO Bora in $2.5B AI drug discovery deal
- This psychiatric hospital CEO wants to retire the term ‘co-occurring’
- Physician assistant median pay hits $135K: State-by-state breakdown
- CHOP increased naloxone co-prescribing from 3% to 84%: Study
- CMS floats 1.68% cut to physician fee schedule, 7 other things to know
- Orthopedic robotics company lands up to $65M in growth capital
- New York awards $6.3M for mental health clubhouses
- Smile Partners USA continues de novo strategy with new practice
- 988 crisis line tops 23M contacts since launch: 5 things to know
- Bipartisan Senate bill targets ASC Medicare reimbursement gap
- Outpatient care to grow 3x faster than inpatient: Report
- Average gross billings for owner dentists surpassed $1M in 2025
- CMS proposes major Medicare reforms to shift physician pay, phase out MIPS and expand ACO participation
- Specialty Dental Brands selects Videa as its AI platform
- States with the most, fewer psychologists per capita
- Oregon State Hospital named in wrongful death lawsuit
- Mobile care DSO Smile America Partners acquired by investment firm
- Judi Health rebrands PBM arm as Judi Rx, unveils Judi Care unit
- With FDA approval for its breast cancer blockbuster hopeful, Celcuity could ‘belong in the hands’ of a Big Pharma
- The specialties winning ASC procedure access — and losing on payment
- Anthropic pushes deeper into healthcare with Optum tie-up, UST integration
- FTC, CVS unveil settlement in ongoing insulin pricing case
- Are ASCs still the right investment? 3 orthopedic surgeons make the case
- What physicians miss when selling their ASC
- HHS promises its final rule barring pediatric gender care providers from Medicare is still coming
- FDA issues psychedelic drug clinical trial guidance: 8 things to know
- AMA interoperability initiative brings structured clinical terminology to CPT codes
- Director's Note on What to Expect at the 2026 Partnerships with Sites Summit
- Rising Tide Dental Partners expands network by 22%, appoints COO
- Lettuce Suspected In Growing Multistate Cyclospora Outbreak
- Startup Sonata launches preventive healthcare membership, linking clinical decisions with AI
- Why Are Family Doctors Leaving The Workforce? Retirement, Burnout Creating A U.S. Primary Care 'Brain Drain'
- HCA Healthcare now expects ACA exchange impacts to exceed $1B in 2026
- Huyabio scores with Opdivo combo in 'milestone' skin cancer trial
- Unruly Patients Are Stressing ER Staff, Undermining Care
- Heatwaves Raise Hospital Admissions For Mental Health Woes
- Pain Patients Should Taper Opioids At Their Own Pace, Study Suggests
- U.S. Gun Suicides Hit Record High, Even As Firearm Deaths Decline Overall
- AstraZeneca pays up to $1.5B for EGFR lung cancer drug Zegfrovy from its spinoff Dizal
- Worried About Your Aging Parents? Welcome To The Caregiving Club
- Knee Pain? Ragged Cartilage? Research Suggests Surgery’s Not the Best Answer

- Lawmakers Look To Make Abortion Shield Laws Less Dependent on Who’s Governor

- Real Chemistry builds body of AI healthcare commercialization tools with Anatomi launch
- Inside agency view: Havas SO on authenticity, connection and pushing back against the ‘sea of sameness’
- Why policy gaps threaten behavioral health coverage
- Specialty dentist pay vs. cost of living by state
- HHS, VA sign agreement to advance psychedelic therapy
- What the de novo boom means for DSOs
- Pearl vs. Videa vs. Overjet: what 3 AI giants have accomplished in 2026
- 8 dental Medicaid updates for dentists to know
- Cellares' recent automated cell therapy wins have 'opened the biotech floodgates'
- Insulet, Calm join forces for diabetes care offerings with ‘Mind in Range’ wellness tools
- Hospital M&A stays hot in Q2 as health systems position for the future
- 13 behavioral health services, facility closures | 2026
- Cottage Health Expands Partnership with hellocare.ai Following Successful Pilot to Deploy AI Assisted Virtual Care and Patient Safety Platform Enterprise Wide
- North Carolina budget allocates millions for first-ever Rural Emergency Hospital reopening
- Payer-backed ad campaign urges lawmakers to reject NSA enforcement bill
- What Is An Aortic Dissection? The Condition That Killed Sen. Lindsey Graham
- Insurers set to pay out $759M in 2026 MLR rebates: KFF
- Weight-Loss Drugs Help, But Exercise Is Still The Key To A Healthier Heart
- FDA's latest onshoring move homes in on streamlined facility registration, foreign plant scrutiny
- Germany pushes through healthcare reform package despite pharma's drug discount resistance
- GSK to seek FDA approval for Jemperli in small but high-profile cancer use after phase 2 win
- Smartphones Can Increase Seniors' Risk Of Depression
- Pro Soccer Players Show Signs Of Shrinking Brains
- Adderall Misuse Falls Sharply Among Young Adults, Study Finds
- New KFF Poll Reveals Who Is Most Likely To Endorse Vaccine Myths
- A New Option For Long-Term Care Costs
- As GOP Cries Fraud, Newsom Backs Medicaid Spending on Housing and Food

- Lupin recalls more than 2.5M prescription eye drop bottles, citing possible contamination
- Digital health funding hits $7.4B in 2026 as AI investment reshapes the market
- Journalists Discuss Raw-Milk Marketing, Extreme Heat, Opioid Settlement Spending

- Doctors want wearable data but healthcare isn't ready for it, AMA survey finds
- Katie Couric's Memory Loss Scare Puts Rare Brain Condition In Spotlight
- Mild COVID Can Lead To Long-Term Hidden Eye Problems
- Star Padcev-Keytruda combo expands bladder cancer reach with FDA approval, pressuring AstraZeneca
- ACO REACH participants generated nearly $1B in 2024 savings: CMS
- Young people living with PKU take the mic in BioMarin podcast series, TikTok push
- Apollo inks €3B equity deal for stake in Bayer's contraceptives business
- Op-ed: Tackling affordability is a shared responsibility. Here's what hospitals are doing
- FDA rejects Hengrui, Elevar’s PD-1 liver cancer combo for a 3rd time
- LGBTQ+ People Less Likely To Be Screened For Some Common Cancers
- Smartphone App Uses Voice To Predict Asthma, COPD Flare-Ups
- Seniors Know How Sharp They Are At Any Given Time, Study Finds
- Patients Face A Thicket of Red Tape Trying To Maintain Consistent Health Coverage
- AI Can Detect Previously Invisible MS Scars In The Brain
- They Harvest the Nation’s Food, but a New Rule May Strip Them of Health Insurance

- A New Option for Long-Term Care Costs

- Sanofi snags FDA thumbs up for Sarclisa as 1st cancer drug delivered by on-body injector
- A $10B deal, China trial scrutiny and highlights from ADA 2026
- Remarks at the Society for Corporate Governance Conference
- GLP-1 Use Hits Record High As Medicare Opens Access To Weight-Loss Drugs
- Beyond Benchmarks: Why Trust Must Be Built into Clinical AI Infrastructure
- Foundation Fights Medical Errors That Claim 200,000 U.S. Lives A Year
- New, Highly Accurate Brush Test Can Detect Mouth Cancer Within An Hour
- Innovative Hip Replacement Cuts Post-Surgery Risk Of Dislocation By 70%
- Global Study Finds Kids Worldwide Skipping Fruits And Vegetables
- Affordable Care Act Insurers Want More Premium Increases As Enrollment Sags
- My Search for a Psychiatric Bed in an Overburdened Health System

- How Lee Health Turned Language Access into a Strategic Clinical Asset
- Decision readiness is the next AI advantage
- E. Coli Outbreak Prompts Recall Of Frozen Blueberries At Publix
- Drinking Coffee May Lower Your Risk of Liver Disease
- Zimmer Biomet to Hire 500 in India as New Bengaluru Technology Centre Drives AI and MedTech Innovation
- AdaptHealth Investigates Data Breach After Social Engineering Attack, Possible Link to ShinyHunters Emerges
- Rumination Plays Key Role In Caregiver Stress, Study Says
- U.S. Teens Underestimate Risks Of Fentanyl Use, Survey Finds
- Men More Likely To Be Diagnosed With Advanced Cancer
- Copay Assistance Is Meant To Defray Patient Drug Costs. Some Insurers Keep It Instead.
- Training Program Could Ward Off Injuries Among Soccer Girls
- Affordable Care Act Insurers Want More Premium Increases as Enrollment Sags

- Patients Face a Thicket of Red Tape Trying To Maintain Consistent Health Coverage

- Accountability Is Key to Medicaid's Home Care Future
- Clinical Success Is No Longer One Number
- Thousands of Medicare Beneficiaries Thought Their Drug Plan Was Free. Then They Lost It.
- Michigan, Other States See Unusual Spike In Parasite That Causes 'Explosive' Diarrhea
- Statement on the 2026 Regulatory Agenda
- 9 of the Top 10 Pharma Manufacturers Partner with Redi Health to Lead the Next-Generation Patient Experience
- GLP-1 'Secret Shopper' Study Finds Gaps in Online Prescribing
- Applying Agentic AI to Healthcare Delivery: The Key to True Transformation

- From Compliance to Clinical Action: Fixing the Broken Loop in Post-Market Surveillance

- Fatty Liver Boosts Odds Of More Deadly Colon Cancer, Study Says
- Weight Loss Surgery Increases Risk Of Alcoholism, Study Says
- IV Vitamin C Might Boost Recuperation Among Trauma Patients
- SCAN Health Plan, Alignment Healthcare sue to challenge CMS' MA star ratings recalculations
- Regulatory tracker: Eisai, Biogen scoop up subQ Leqembi starter dose nod
- Remarks at the Economic Club of New York
- Is Your Organization Ready to Govern AI in Regulatory Affairs?

- CMS Proposes TAVR Medicare Coverage is Potential Boost for Edwards Lifesciences
- Remarks to the US-CEE Connection: Transatlantic Challenges in Law, Business & Policy
- Statement Regarding Minimum Pricing Increments and Access Fee Caps
- Statement at the SEC Open Meeting on the Trade-Through Rule and Locked and Crossed Markets Provisions of Regulation NMS
Michigan healthcare freedom community forum

Associated Press is out this morning with a breathless story about the extent of workplace violence in health care. The actual story is more nuanced and, when you read the BLS Fact Sheet covering 2018 (which is the entire basis of the AP story), you observe in its Table 1 that work place violence in health care is largely due to incidents at psychiatric and substance abuse treatment venues. A point completely ignored by AP. The emergency room shootings which garner attention in the media are still uncommon occurrences:
https://www.bls.gov/iif/factsheets/workplace-violence-healthcare-2018.htm
Fact Sheet | Workplace Violence in Healthcare, 2018 | April 2020
Workplace Violence in Healthcare, 2018
Workplace violence in healthcare is an important public health issue and a growing concern. Workplace violence and healthcare can be defined in different ways. This analysis focuses on intentional injuries1 caused by another person to workers in the private healthcare and social assistance industry2 and will not look at healthcare related occupations.3
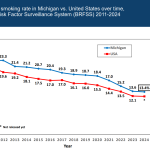
In 2018, the private ownership all-worker incidence rate for nonfatal occupational injuries and illnesses involving days away from work resulting from intentional injury by other person in the private healthcare and social assistance industry was 10.4 per 10,000 full-time workers, compared to the all-worker incidence rate of 2.1. The health care and social service industries experience the highest rates of injuries caused by workplace violence and are 5 times as likely to suffer a workplace violence injury than workers overall. Chart 1 shows how the incidence rate for workplace violence to healthcare workers has increased since 2011.
Chart 1. Incidence rate of nonfatal workplace violence to healthcare workers,2011-18Incidence rate per 10,000 full-time workers20112012201320142015201620172018024681012Click legend items to change data display. Hover over chart to view data.Source: U.S. Bureau of Labor Statistics.Workplace violence due to intentional injuries by other person in the private healthcare and social assistance industry accounted for 2 percent of the 900,380 total nonfatal occupational injuries or illness cases requiring days away from work in 2018.
Healthcare workers accounted for 73 percent of all nonfatal workplace injuries and illnesses due to violence in 2018 (see chart 2). The industry’s number of total workplace violence has grown since 2011, the first year the new OIICS 2.01 event classification was used. You can find the latest data on the types of events and industry make-up of nonfatal cases using resource table 4, https://www.bls.gov/iif/nonfatal-injuries-and-illnesses-tables.htm#dafw .
Chart 2. Number of nonfatal workplace violence injuries and illnesses withdays away from work, 2011-18Healthcare industryOther industries2011201220132014201520162017201805,00010,00015,00020,00025,000Click legend items to change data display. Hover over chart to view data.Source: U.S. Bureau of Labor Statistics.The healthcare and social assistance industry is made up of a mix of industry services. Table 1 gives a high level look at the components of the healthcare and social assistance industry, along with their respective incidence rates. If you would like to learn more about a specific sub-sector, the online profiles tool will create industry specific profiles detailing demographics, case circumstances, including event, and occupations for each industry.
Table 1. Incidence rate of nonfatal intentional injury by other person, by selected industries, 2018 Private Industry NAICS code Incidence rate of nonfatal intentional injury by other person, per 10,000 full-time workers All Industry
2.1 Health care and social assistance
62 10.4 Ambulatory health care services
621 3.1 Hospitals
622 12.8 Psychiatric and substance abuse hospitals
6222 124.9 Nursing and residential care facilities
623 21.1 Social Assistance
624 12.4 Child day care services
6244 7.8 Looking briefly at the public sector, in 2018 the incidence rate of intentional injury for nonfatal cases involving days away from work in the health care and social assistance was 13.9 per 10,000 full-time workers (1,050 cases) in local government, and 89.3 (4,850 cases) in state government. The all-worker incidence rate for cases involving days away from work for local government was 163.9 and for state government was 142.6.
Fatal Data
From 2011 to 2018, there were 156 workplace homicides to private healthcare workers, averaging about 20 each year. The most common assailant in workplace homicides to healthcare workers was a relative or domestic partner of the injured worker (see Chart 3).
Chart 3. Workplace homicides to healthcare workers, by assailant, 2011-18Number of fatal injuriesRelative or domestic partnerAll other, including unknownPatientCo-worker or work associateOther client or customerAcquaintanceRobber01020304050Click legend items to change data display. Hover over chart to view data.Source: U.S. Bureau of Labor Statistics.In 2018, workplace homicides in the private healthcare and social assistance industry accounted for 4 percent of the total workplace homicides. For total fatal cases, homicides to healthcare workers made up less than 1 percent of the 5,250 workplace fatalities in 2018. For more information, see the data table for workplace homicides.
Related Publications
Hospital workers: an assessment of occupational injuries and illnesses: https://www.bls.gov/opub/mlr/2017/article/pdf/hospital-workers-an-assessment-of-occupational-injuries-and-illnesses.pdf
Occupational injuries and illnesses among registered nurses: https://www.bls.gov/opub/mlr/2018/article/occupational-injuries-and-illnesses-among-registered-nurses.htm
Hospital workers suffered 294,000 nonfatal workplace injuries and illnesses in 2014: https://www.bls.gov/opub/ted/2016/hospital-workers-suffered-294000-nonfatal-workplace-injuries-and-illnesses-in-2014.htm
A look at violence in the workplace against psychiatric aides and psychiatric technicians: https://www.bls.gov/opub/mlr/2015/article/a-look-at-violence-in-the-workplace-against-psychiatric-aides-and-psychiatric-technicians.htm
Workplace Homicides: https://www.bls.gov/iif/factsheets/workplace-homicides-2017.htm
Workplace Safety and Health in the Health Care and Social Assistance Industry, 2003-07: https://www.bls.gov/opub/mlr/cwc/workplace-safety-and-health-in-the-health-care-and-social-assistance-industry-2003-07.pdf
For technical information and definitions, please see the BLS Handbook of Methods.
You can obtain data from the Injuries, Illnesses, and Fatalities program by using the following tools: Create Customized Tables (Multiple Screens), Create Customized Tables (Single Screen), and the Online Profiles System. Additional tables and charts are on the IIF homepage and the IIF State page.
Source
U.S. Bureau of Labor Statistics. Fatality data are from the Census of Fatal Occupational Injuries. Nonfatal injury and illness data are from the Survey of Occupational Injuries and Illnesses.
Notes
1 The BLS Injuries, Illnesses, and Fatalities (IIF) program has used the Occupational Injury and Illness Classification System (OIICS), version 2.01, when classifying Event or Exposure, Primary Source, Secondary Source, Nature, and Part of Body since 2011. More on OIICS 2.01 can be found here: https://www.bls.gov/iif/definitions/occupational-injuries-and-illnesses-classification-manual.htm . Event code 1* is the broad category of Violence and other injuries by persons or animals, with the sub categories of 11* (comprised of 111* Intentional injury by other person and 112* Self-inflicted injury—intentional), 12* Injury by person—unintentional or intent unknown, and 13* Animal and insect related incidents.
2 This fact sheet will use the private Healthcare and Social Assistance industry (North American Industry Classification System, NAICS 62*) when referring to healthcare workers unless otherwise noted. For 2009 to 2013 data, the IIF program used the 2007 North American Industry Classification System (NAICS) to classify industry data. Since 2014, the IIF program has used the 2012 NAICS. More on NAICS can be found here: https://www.bls.gov/bls/naics.htm .
3 If you are interested in specific occupations, such as nurses; social workers; psychiatric, home health, and personal care aides, you may wish to explore nonfatal tables R12 and R100, create a customized table using online profiles, or view the fatal table detailed occupations by homicides. Since 2011, the IIF program has used the 2010 Standard Occupational Classification (SOC) system to classify occupation. More on SOC can be found here: https://www.bls.gov/soc/ .
BLS released a TED on November 21, 2022 which reported 392 workplace homicides and 37,060 nonfatal injuries in the all workplaces during 2020 resulting from an intentional injury by another person. It does not break out health care, but lumps them into technical occupations. It will be a year or two before BLS gives us a more granular report.

Workplace violence: homicides and nonfatal intentional injuries by another person in 2020
November 21, 2022There were 392 workplace homicides in 2020. There were also 37,060 nonfatal injuries in the workplace resulting from an intentional injury by another person.
The five occupational groups with the most workplace homicides in 2020 were sales and related, transportation and material moving, management, construction and extraction, and production. Homicides in sales and related occupations accounted for 23.5 percent of all workplace homicides in 2020.
Workplace homicides by selected occupational group, 2020 Occupational group Number of homicides Sales and related
92 Transportation and material moving
51 Management
29 Construction and extraction
20 Production
18 Service occupations accounted for about half of all nonfatal intentional injuries by another person that required at least a day away from work in 2020. Service occupations include healthcare support, protective service, food preparation and serving related, building and grounds cleaning and maintenance, and personal care and service occupations. Healthcare practitioners and technical occupations made up about 23 percent of cases.
Nonfatal workplace intentional injuries by another person that required at least a day away from work, selected occupational groups, 2020
These data are from the Injuries, Illnesses, and Fatalities program. Fatal and nonfatal cases shown here represent injuries within the private and public sector. To learn more about fatal injuries, see "National Census of Fatal Occupational Injuries in 2020." We also have more charts on fatal work injuries. To learn more about nonfatal injuries and illnesses, see "Employer-Reported Workplace Injuries and Illnesses – 2020," "Employer-Reported Workplace Injuries and Illnesses – 2021," and charts on nonfatal injuries and illnesses.
Get MHF Insights
News and tips for your healthcare freedom.
We never spam you. One-step unsubscribe.
Sponsors

J & DE Family Charitable Fund

Friends
of MHF
Kelly Grotendiek
Philip Harbach
Dale Johnson
Drs. Jeffrey and Joni Jones
Vickie Kahle
Tammy Kipen
Marlin & Kathy Klumpp
Melanie Kurdys
Ruth Nobel
Patrick Peterson
Stephanie Poortenga
Jeanne Smit
Ben and Hope Staal
John Tuinstra
Jacki VanHuis
Sandy Walker
Sign Up for MHF Insights to keep up on the latest in Michigan Health Policy

